Onboard Checklist
The Onboard Checklist ensures that all required base configurations are completed before users start working in the MES system.
This checklist helps administrators verify that the system is properly configured for the selected location.
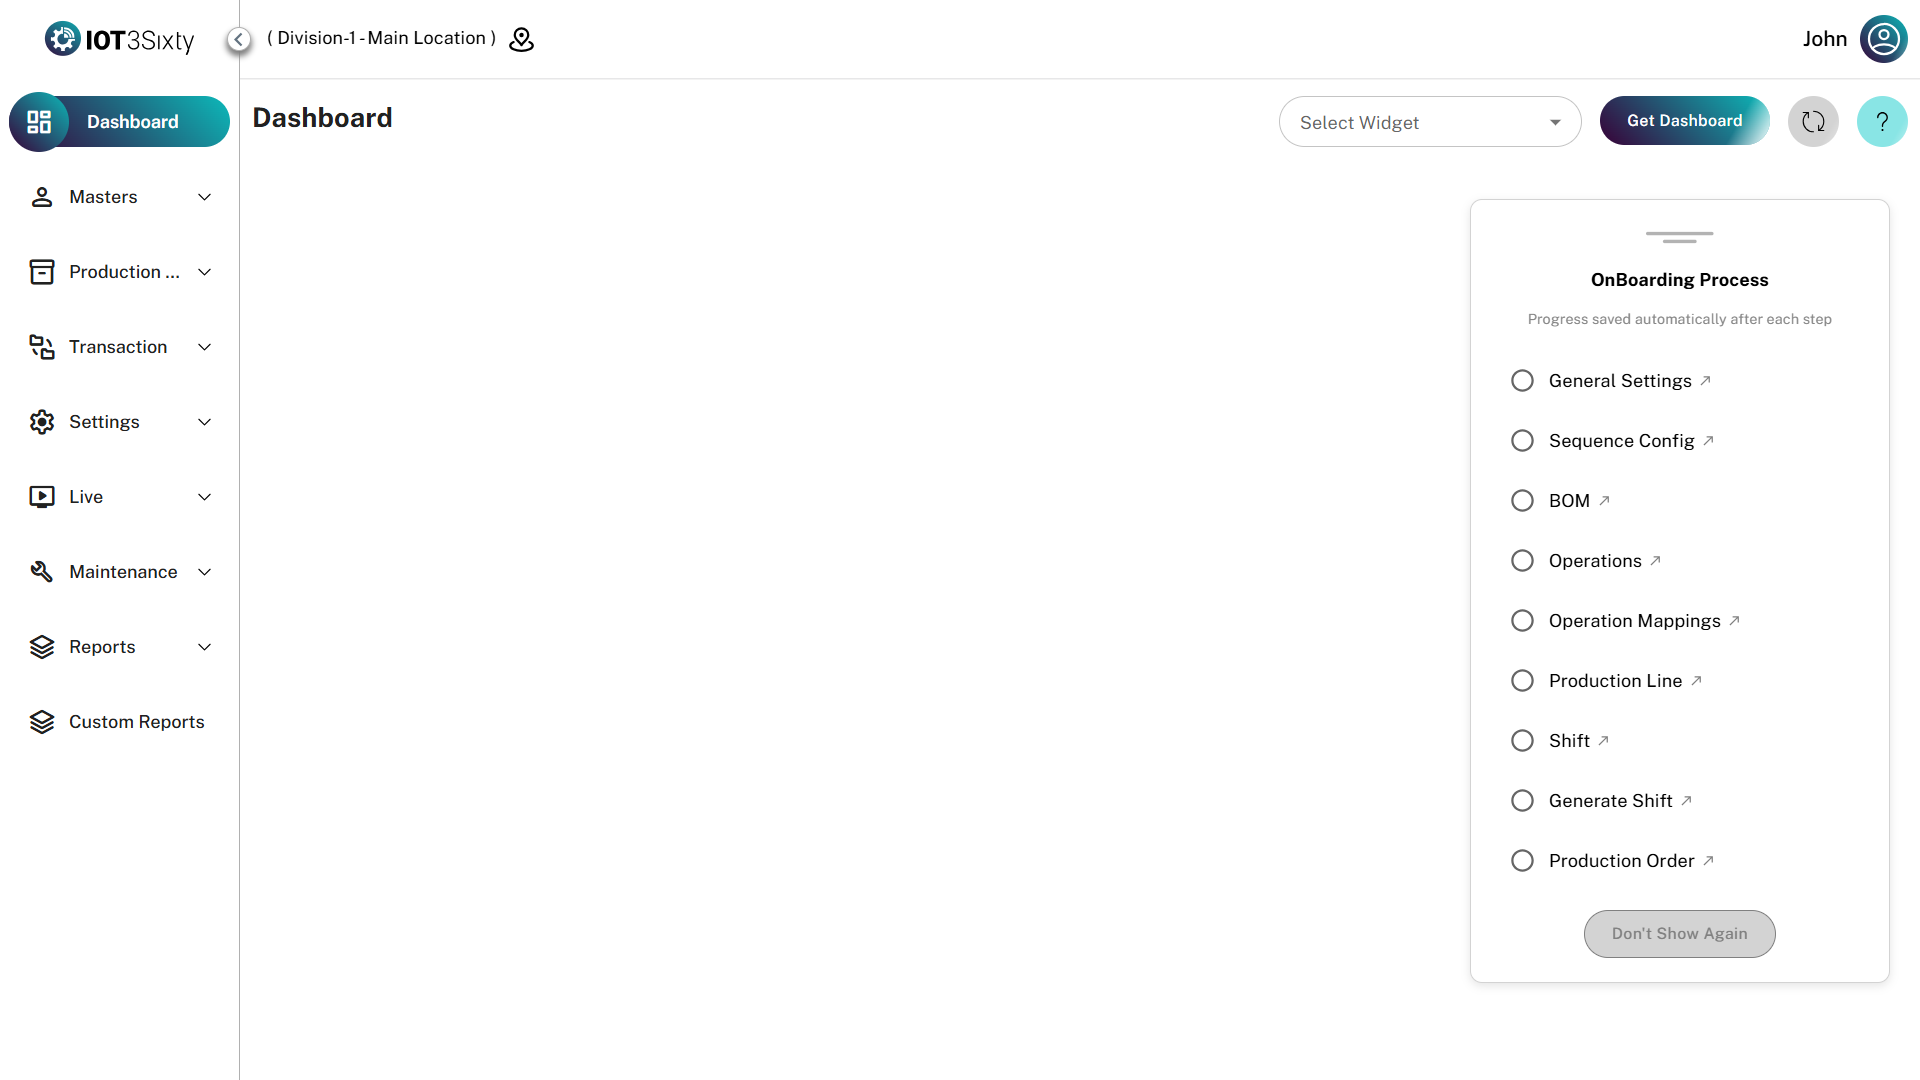
When the Onboard Checklist Appears
- User logs into the MES application.
- The user selects a Location / Plant.
- After selecting the location, the system opens the Application.
- Inside Application, the Base Setup Onboard Checklist will be displayed.
This checklist appears only when the base configuration for that location has not been completed.
Purpose of the Onboard Checklist
The checklist ensures that all mandatory system configurations are completed before starting production or warehouse operations.
It helps to:
- Ensure the system is properly configured
- Avoid missing master data
- Maintain operational consistency
- Prevent errors during production or inventory transactions
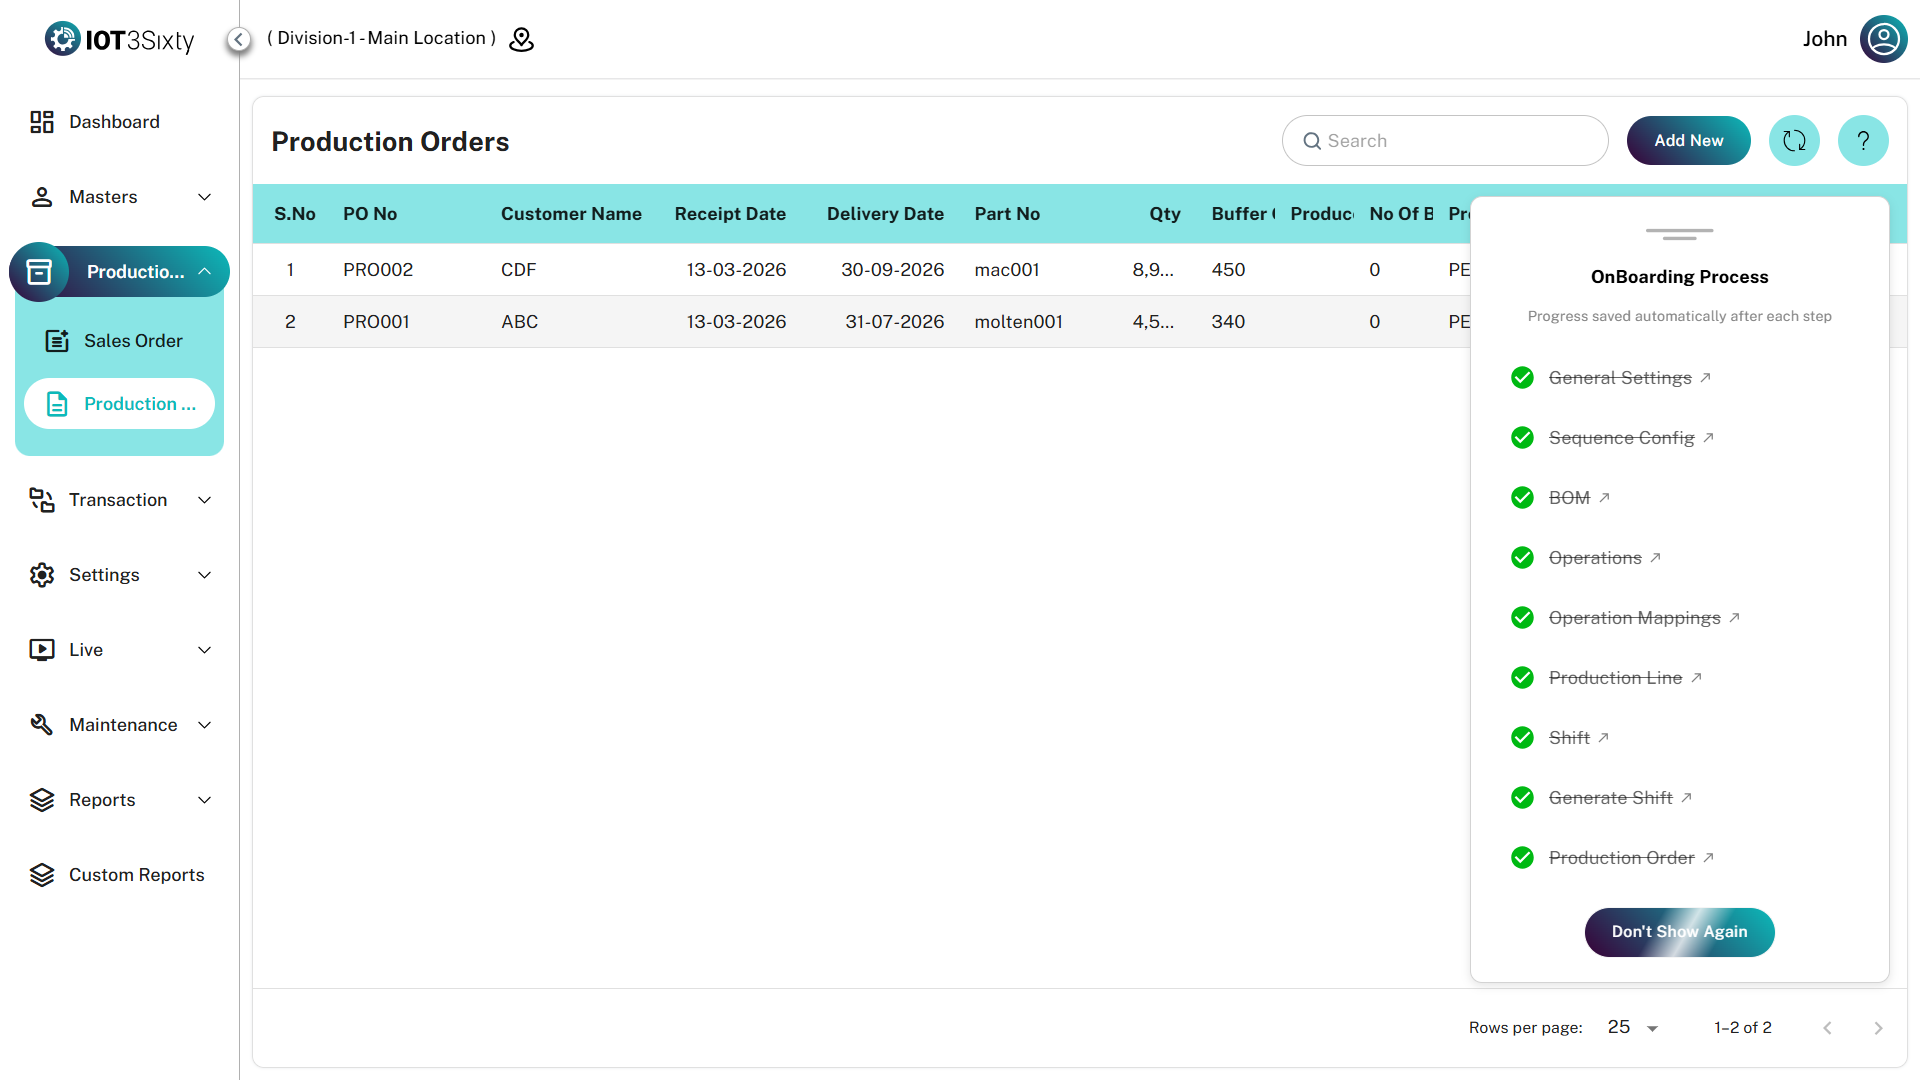
Checklist Behavior
Each configuration step is displayed as a separate checklist item.
- Every item must be completed one by one.
- Each line represents a mandatory setup task.
- When a configuration is completed:
- The item will be marked with a Tick (✔).
- If a configuration is incomplete:
- It will remain unmarked or highlighted.
All checklist items must be completed before the process can be finalized.
Mandatory Completion Rule
The system enforces the following rules:
- All checklist items must be completed.
- Every line must show a tick mark indicating completion.
- Until all tasks are completed, the checklist cannot be closed permanently.
"Don't Show Again" Option
Once all checklist items are completed, the "Don't Show Again" button becomes enabled.
Functionality
When the user clicks Don't Show Again:
- The onboard checklist will be hidden permanently for that location.
- The checklist will not appear again during login.
- Users can continue normal system operations without interruption.
Important Notes
- The checklist appears only during the initial system setup.
- It is recommended that administrators complete all configuration tasks carefully.
- If the base setup is incomplete, certain modules in MES may not function properly.
Summary
The Onboard Checklist is a guided setup process that ensures the MES environment is fully configured before operational use.
By completing all checklist steps, organizations can ensure a smooth and error-free system implementation.
Dashboard
The Dashboard is the central graphical interface for monitoring real-time production metrics, KPIs, and operational status.
It displays a customizable grid of widgets designed to provide live insights into production performance and operational activities.
Dashboards are typically configured based on project requirements, production modules, and location context.
Key Features
| Feature | Description |
|---|---|
| Dynamic Layout Maps | The dashboard layout automatically adjusts based on configured widget sizes (e.g., 50% width or full-width widgets) |
| Live Analytics | Widgets marked as Live automatically update as new production data is ingested |
| Multi-Widget Support | Supports multiple visual components such as Text Cards, Line Charts, Bar Charts, Pie Charts, Gauge Indicators, and SVG diagrams |
| Project & Location Context | Dashboard data is automatically filtered based on the current module and session location |
How to Use the Dashboard
1. Loading a Dashboard View
Follow these steps to load a dashboard.
- At the top of the page, open the Select Widget dropdown.
- Choose the desired dashboard configuration from the list.
- Click Get Dashboard to load the widgets into the main display area.
The system usually auto-loads the first available dashboard configuration by default.
2. Auto-Refresh & Manual Updates
- Widgets marked as Live automatically update when new production data is available.
- To manually refresh the entire dashboard, click the Refresh icon in the header toolbar.
This ensures you are viewing the latest operational data.
3. Understanding Dashboard Widgets
The dashboard supports multiple widget types to visualize different kinds of production data.
| Widget Type | Description |
|---|---|
| Charts | Visual graphs such as Line Charts, Bar Charts, and Pie Charts showing trends or categorized data |
| Cards | Displays key metrics such as current shift production output or KPI values |
| SVG Visualizations | Interactive diagrams representing factory layouts, machines, or workflows |
For charts, you can hover over data points to view exact values and timestamps.
Troubleshooting
Empty Dashboard
If the dashboard loads with no widgets:
- Ensure your Session Location is correctly selected.
- Dashboards are filtered based on location-specific data.
Missing Dashboard Options
If the Select Widget dropdown appears empty:
- Your user profile may not have dashboard mappings assigned.
- Contact system support using the Help (Headset) icon in the top-right corner.
Dashboards are most effective when displayed on large screens or monitoring displays to give teams continuous visibility into production performance and KPIs.