Kanban Monitor
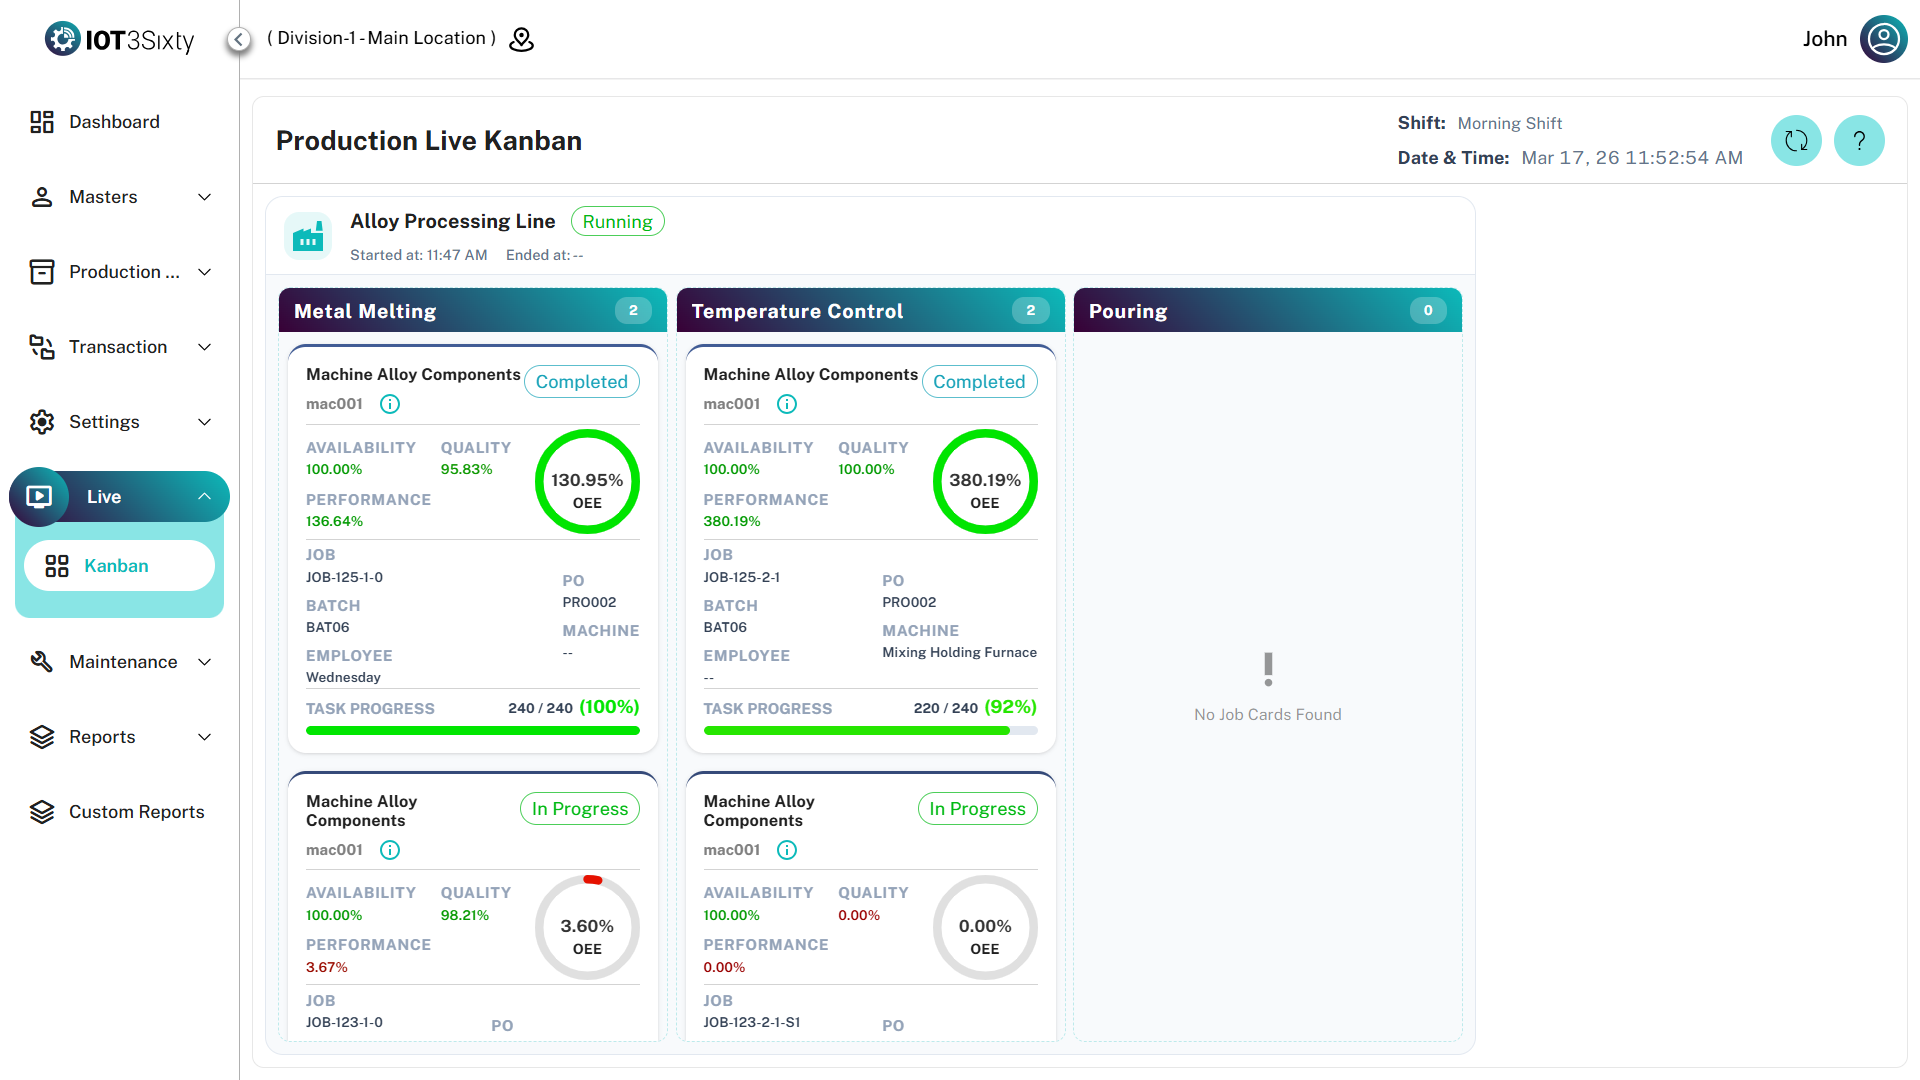
The Kanban Monitor is a real-time production dashboard used by floor managers and supervisors to visualize the current state of production lines.
It provides instant visibility into job progress, machine activity, and operational efficiency (OEE) so teams can quickly identify delays or bottlenecks on the shop floor.
1. Dashboard Controls & Header
The header section provides global context about the current production environment.
Header Elements
| Field | Description |
|---|---|
| Shift | Displays the currently active shift (e.g., General Shift, Night Shift) |
| Live Time | Real-time clock synchronized with server time |
| Auto Refresh | Dashboard refreshes automatically based on system configuration |
| Manual Refresh | Users can manually refresh the dashboard using the Refresh button |
No Active Shift
If no production shift is running, the system will display the message:
"There is no running shift."
This ensures that the monitor only displays active production data.
2. Production Line Overview
Each production line appears as a large container card showing its status and performance.
Line Status Types
| Status | Description |
|---|---|
| Running | The line is currently active and processing job cards |
| Stopped | The line has been stopped |
| Yet To Start | Production has not started for the shift |
Line Information
| Field | Description |
|---|---|
| Start Time | Time when the production line started running |
| Expected End Time | Scheduled completion time for the current shift |
This helps supervisors quickly identify which lines are active and which are delayed.
3. Operations & Job Cards
Within each production line, work is organized into operations such as:
- Casting
- Machining
- Finishing
Each operation contains individual job cards that represent the specific production tasks.
Job Card Details
| Field | Description |
|---|---|
| Part Info | Displays the part name and part code being processed |
| Info Icon (i) | Opens detailed part specifications |
| Production Order (PO) | Production order associated with the job |
| Batch | Batch number for traceability |
| Machine Name | Machine performing the operation |
| Employee | Operator assigned to the job |
These details allow supervisors to quickly trace production tasks and responsibilities.
4. Performance & OEE Metrics
Each job card includes performance indicators that help identify efficiency issues in real time.
OEE Components
| Metric | Description |
|---|---|
| Availability | Actual machine running time compared to planned production time |
| Quality | Ratio of good parts produced versus total output |
| Performance | Actual production speed compared to ideal cycle time |
OEE Score
The Overall Equipment Effectiveness (OEE) score is displayed using a circular progress indicator.
| Color | Meaning |
|---|---|
| Red | Low efficiency |
| Yellow | Average performance |
| Green | Optimal performance |
Task Progress
| Field | Description |
|---|---|
| Progress Bar | Shows produced quantity relative to target quantity |
| Completion % | Percentage of job completion |
This allows supervisors to monitor production progress at a glance.
For best visibility, display the Kanban Monitor on a large screen or overhead display on the shop floor.
This helps the entire production team stay aligned with hourly targets and quality goals.
All OEE metrics displayed in the Kanban Monitor are calculated dynamically using real-time data from the Job Execution and Downtime modules.