Operation Report
The Operation Report is a comprehensive analytical tool used to monitor **production performance and operational **.
It consolidates production inputs, outputs, downtime events, and quality data into a single dashboard, helping supervisors and production managers evaluate performance across operations.
This report is particularly useful for analyzing productivity, identifying bottlenecks, and reviewing shift performance.
Key Features
| Feature | Description |
|---|---|
| Unified Dashboard | View Inputs, Quality Control (QC), and Downtime information within one integrated interface |
| Dual Reporting Modes | Switch between Summary View (job card level overview) and Detail View (complete performance breakdown) |
| Execution Monitoring | Track real-time operation status and execution duration measured in minutes |
| Export Support | Export structured or flattened datasets for complex nested production tasks |
Data Breakdown
1. Summary View
The Summary View provides a high-level overview of operation performance.
| Field | Description |
|---|---|
| Job Card Reference | Unique identifier for the production task |
| Production Line | Line where the operation was executed |
| Operation Name | The specific manufacturing operation |
| Start Time | When the operation began |
| End Time | When the operation was completed |
| Duration | Total execution time in minutes |
| Status | Current execution state (Running, Completed, Stopped) |
This view is useful for quick monitoring of production execution across job cards.
2. Detail View
The Detail View provides a comprehensive breakdown of operational activity.
| Category | Details |
|---|---|
| Inputs | Materials consumed or issued for the operation |
| Quality Control | QC checks, rejected quantities, and scrap entries |
| Downtime | Downtime events and associated reasons |
| Performance Logs | Time-based logs capturing operational activities |
This view allows supervisors to identify productivity issues, downtime patterns, and quality deviations.
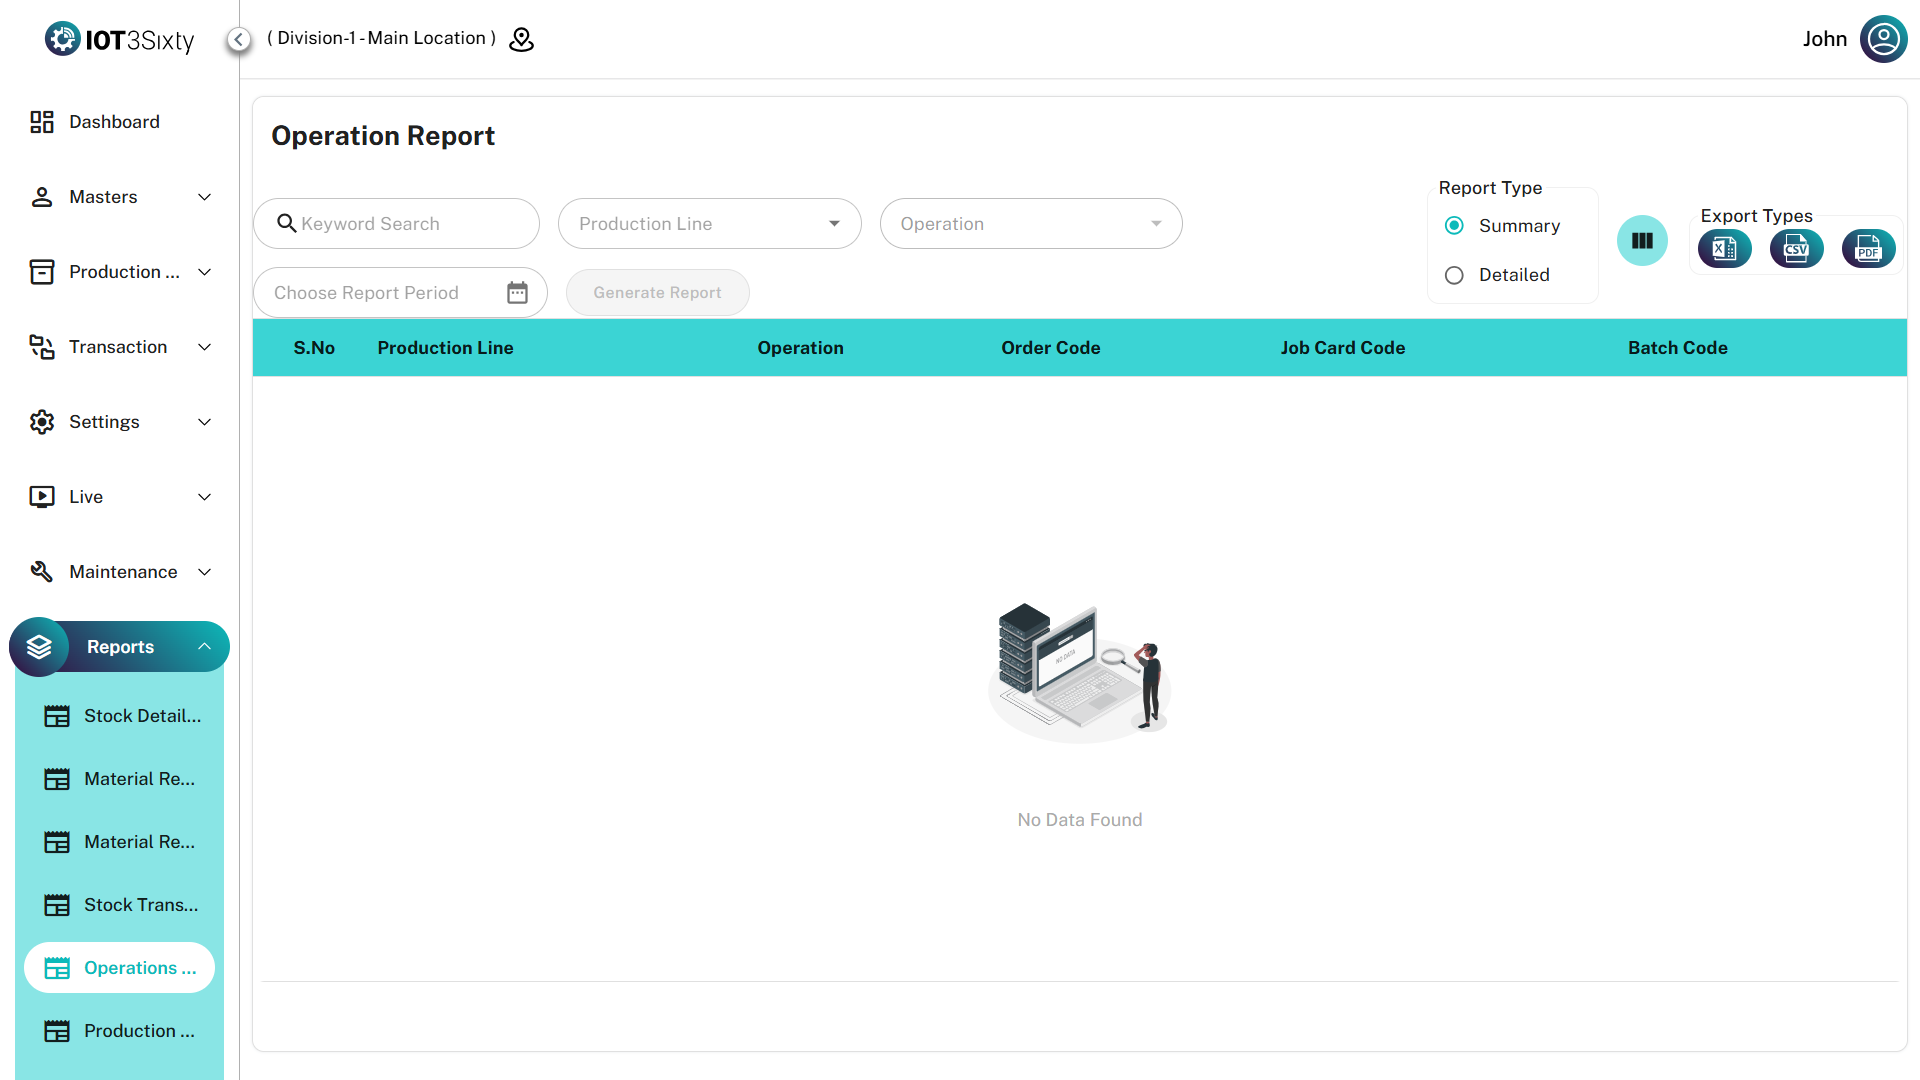
User Instructions
Follow the steps below to generate the report.
1. Selection
- Select the Production Line.
- Choose the Operation (optional).
- Define the Report Period / Date Range.
2. Generate Report
Click Generate Report to load the dashboard data.
3. Analyze Performance
- Switch to Detail View to examine inputs, scrap entries, and downtime reasons.
- Review execution durations and status for each operation.
4. Refine the Results
- Use the Column Selector to customize visible data fields.
- Use the Search bar to quickly locate specific job cards or operations.
5. Export the Report
Use the export icons in the toolbar to download the report in:
- Excel
- CSV
The Detail View is especially useful during shift reviews, helping supervisors quickly identify performance bottlenecks, downtime causes, and quality deviations in real time.